
Benchmark against AVL
Updated November 28, 2023------------------ WORK IN PROGRESS ------------------
Contents
- Purpose
- Derivative calculation
- Test case
- Stability derivatives
- Control derivatives
- Conclusion and recommendations
Back to main table of contents
Purpose
The goal of this study is to
- Benchmark flow5's prediction of stability and control derivatives with the predictions made by AVL.
- Perform parametric analyses to determine the sensitivity of the derivatives to variables such as the angle of attack, the inclusion of the fuselage in the model and the type of panel method.
- Establish guidelines for the calculation of the derivatives.
Note: A previous version of this page presented a comparison of flow5 v7.13 results to AVL 3.27. This updated benchmark presents a comparison of flow5 v7.24 to AVL 3.36. Not much has changed on the AVL side and the results are the same.
On the flow5 side:
- Signs of the lateral coefficients CY, Cl and Cn have been homogenized internally and aligned with the convention used by AVL.
- Moments Cl and Cn are evaluated in wind axes instead of body axes; Cm is unchanged since the y-axis is the same in both frames
- In the case of thick surface calculations, the contribution of wing tip panels has been excluded since they are areas of high pressure and velocity gradients which would be damped by viscosity in reality. Up to v7.23 this has been the cause of spurious evaluations of moments. See this page for detailed explanations.
Back to top
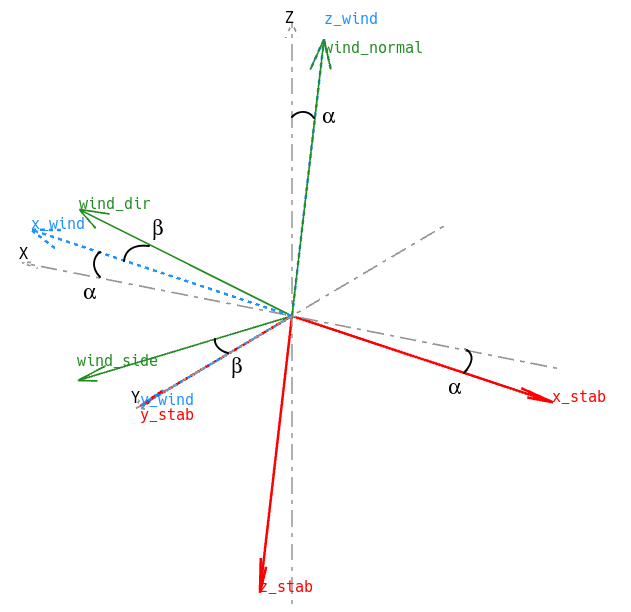
Axes and frames of reference
The axes in which the forces, moments and aerodynamic coefficients are expressed are detailed here.
Lift and drag are expressed in wind axes.
The pitching moment is around the wind y-axis which is the same as the geometric y--axis.
The rolling and yawing moments are around respectively the wind's x and z axes.
The axes are set in AVL as follows:
A xis orient. : Geometric axis orientation, X aft, Z up
R ate,mom axes: Rates,moments about Stability Axes, X along Vinf
Derivative calculation
The methods to calculate the derivatives differ in AVL and flow5. To the author's understanding, the methods implemented in AVL are the ones described in "Flight Vehicle Aerodynamics", Mark Drela 2014.
Stability derivatives
AVL
The method takes advantage of the linear dependency of the panel forces with the 6 degrees of freedom in motion. This allows to express the stability derivatives explicitly, and to and solve them by direct back-substitution and linear combination which makes their calculation fast and accurate.
flow5 v7.24
The derivatives are evaluated using finite differences.
The method used by AVL could be implemented for flow5's VLM. However it is not transposable to the thick surface panel methods in which the pressure forces are derived from the surface gradient of the doublet densities and do not depend linearly on the freestream's angle of attack and sideslip.
Control derivatives
The rotations of the control surfaces change both the linear system's matrix and the right hand side (RHS) vector. Strictly speaking, the problem should therefore be built and solved entirely for each derivative. This however would be computationally very expensive. A standard procedure is to assume that the change to the influence matrix is small, so that the LU-factorized matrix can be reused as-is, and that only the change to the RHS needs to be implemented. This simplification reduces the computations to the construction of the RHS and to its back-substitution.
This is how AVL, flow5 and other panel codes proceed. A numerical experiment was carried out with flow5 to evaluate the error implicit in this approximation and is presented hereafter.
AVL
The boundary condition are linearized since only the first order development is required, and the derivatives are calculated explicitly and solved by direct back-substitution and linear combination of deflections.
flow5 v7.24
The problem cannot be linearized for the same reason as in the case of the stability derivatives. The derivatives are calculated by finite differences, with an RHS vector being constructed and back-substituted for each derivative.
Back to top
Test case
Description
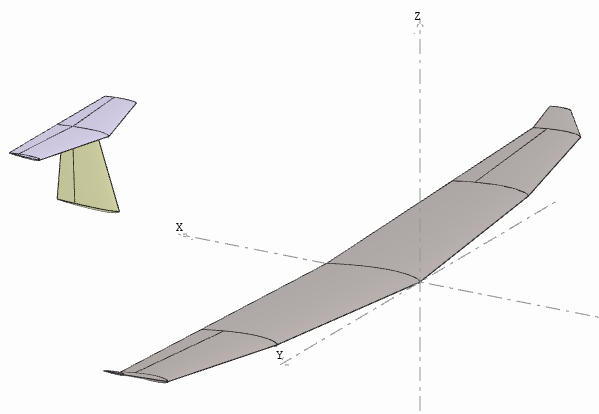
The test case is the simple 1.5 m span fictitious plane illustrated in the image on the right.
To keep the comparisons with AVL relevant:
- The fuselage was not included in the model.
- All flow5 analyses are inviscid.
- The first set of calculations in flow5 was done with the VLM2.
The corresponding flow5 and AVL project files can be downloaded here.
Model validation: linear analyses
The purpose of these first runs is to check that the analyses are set up identically in flow5 and AVL.
Type 1 comparisons at β=0°


Both AVL and flow5 predict that the pitching moment is zero at α = 1.07°.
Type 5 comparisons at α=0°


Type 5 comparisons at α=7°


Stability derivatives
VLM, no fuselage
The intent of this first run is to compare the stability derivatives using the VLM common to both programs.
The stability derivatives are compared at the zero pitching moment angle, i.e. α = 1.08° for both programs.
| AVL 3.36 | flow5 7.24 | deviation | |
|---|---|---|---|
| CLa | 5.469969 | 5.4932 | 0.4% |
| Cma | -1.389971 | -1.4483 | -4.0% |
| AVL 3.36 | flow5 7.24 | deviation | |
|---|---|---|---|
| CYb | -0.111854 | -0.129153 | -13.4% |
| Clb | -0.064076 | -0.056346 | 13.7% |
| Cnb | 0.035702 | 0.042822 | -16.6% |
| AVL 3.36 | flow5 7.24 | deviation | |
|---|---|---|---|
| CYp | -0.073157 | -0.093627 | -21.9% |
| Clp | -0.555007 | -0.55689 | -0.3% |
| Cnp | -0.016401 | -0.002399 | 583.7% |
| AVL 3.36 | flow5 7.24 | deviation | |
|---|---|---|---|
| CLq | 9.345922 | 9.489867 | -1.5% |
| Cmq | -15.269398 | -15.855615 | -3.7% |
| AVL 3.36 | flow5 7.24 | deviation | |
|---|---|---|---|
| CYr | 0.091689 | 0.096878 | -5.4% |
| Clr | 0.056059 | 0.007483 | 649.2% |
| Cnr | -0.031223 | -0.035711 | -12.6% |
The derivatives are in reasonable agreement except for Cnp and Clr. To understand the discrepancy, the derivatives have been plotted as a function of the angle of attack.


As it appears, the value of the derivatives Cnp and Clr estimated by AVL depend strongly on the angle of attack, which makes them very sensitive to the point of evaluation. No obvious explanation could be found for this difference of sensitivity exhibited by both programs.
The other lateral derivatives are sensitive to the angle of attack to various degrees.


On the other hand, the longitudinal derivatives are not sensitive to the angle of attack.

Influence of the panel method
In the case of the thick surfaces, the contribution of pressure forces acting on the wing tips have been excluded. These area exhibit high velocity gradients and pressures and tend to lead to erroneous values of the moments.
The option to exclude wing tips has been introduced in v7.24.
|
VLM2 |
Tri-uni thick |
deviation |
Tri-uni thin |
deviation | |
|
CXa |
0.122011 |
0.129176 |
5.9% |
0.124578 |
2.1% |
|
CZa |
-5.493210 |
-5.768376 |
5.0% |
-5.637121 |
2.6% |
|
Cma |
-1.448319 |
-1.513102 |
4.5% |
-1.222066 |
-15.6% |
|
CXq |
-0.257699 |
-0.251504 |
-2.4% |
-0.267188 |
3.7% |
|
CZq |
-9.489867 |
-9.790366 |
3.2% |
-9.574476 |
0.9% |
|
Cmq |
-15.855615 |
-16.935438 |
6.8% |
-10.780685 |
-32.0% |
|
CYb |
-0.129153 |
-0.120939 |
-6.4% |
-0.119009 |
-7.9% |
|
Clb |
-0.056346 |
-0.068328 |
21.3% |
-0.048850 |
-13.3% |
|
Cnb |
0.042822 |
0.044269 |
3.4% |
0.027791 |
-35.1% |
|
CYp |
-0.093627 |
-0.098894 |
5.6% |
-0.098166 |
4.8% |
|
Clp |
-0.556894 |
-0.576122 |
3.5% |
-0.389043 |
-30.1% |
|
Cnp |
-0.002399 |
-0.006300 |
162.6% |
0.001362 |
-156.8% |
|
CYr |
0.096878 |
0.089338 |
-7.8% |
0.087987 |
-9.2% |
|
Clr |
0.007483 |
0.013933 |
86.2% |
0.003949 |
-47.2% |
|
Cnr |
-0.035711 |
-0.033797 |
-5.4% |
-0.023621 |
-33.9% |
The scattering of the predictions can be quite large depending on the derivative, but is not easy to interpret.
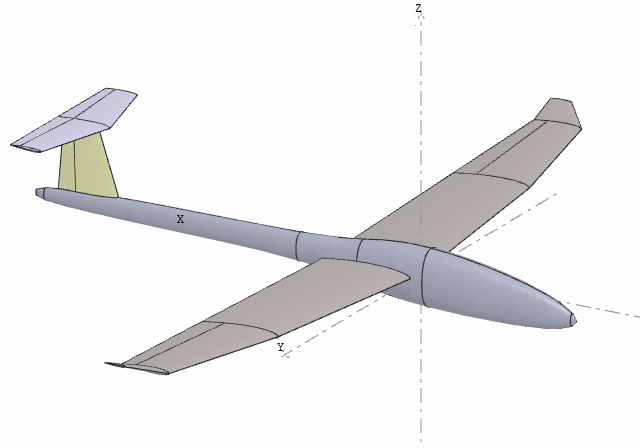
Influence of the fuselage
A slender fuselage was added to the flow5 model to evaluate its influence on the derivatives. The inertia properties were kept identical for the models with and without the fuselage.
The comparisons were performed using the tri-uniform method.
The contribution of the wing tips has been excluded for the reasons mentioned above and so has the contribution of fuselage panels.
The calculated zero-pitching moment angles are close: 1.55° for the model without the fuselage, and 1.40° with the fuselage.
| no fuselage | with fuselage | deviation | |
|---|---|---|---|
| CXu | -0.0034175 | -0.004320 | 26.4% |
| CZu | -0.000093 | -0.000106 | 13.2% |
| Cmu | -0.004868 | -0.004418 | -9.2% |
| CXa | 0.160790 | 0.099582 | -38.1% |
| CZa | -5.763000 | -5.669000 | -1.6% |
| Cma | -1.652300 | -1.752500 | 6.1% |
| Cxq | 0.214170 | 0.154110 | -28.0% |
| CZq | -9.840400 | -9.692200 | -1.5% |
| Cmq | -16.849 | -16.865 | 0.1% |
| CYb | -0.12026 | -0.14292 | 18.8% |
| Clb | -0.058095 | -0.059846 | 3.0% |
| Cnb | 0.043516 | 0.047060 | 8.1% |
| CYp | -0.097563 | -0.090962 | -6.8% |
| Clp | -0.57233 | -0.57528 | 0.5% |
| Cnp | -0.011734 | -0.01299 | 10.7% |
| CYr | 0.1012 | 0.11863 | 17.2% |
| Clr | 0.106980 | 0.101010 | -5.6% |
| Cnr | -0.03494 | -0.037437 | 7.1% |
The inclusion of the fuselage changes the derivatives to various degrees. The variations are not easy to interpret although some can be expected such as:
- the increase of Cxq due to the perturbation of the flow when the fuselage is not aligned with the x axis
- the increase of CYb due to the fuselage's lateral surface
Back to top
Control derivatives
Result comparison
The derivatives have been evaluated in flow5 using the VLM2 method to be consistent with AVL.
The control derivatives are only evaluated in flow5 as part of a T7 analysis and are therefore calculated at the zero-pitching moment angle.
Aileron
| AVL | flow5 | deviation | |
|---|---|---|---|
| CXd | |||
| CYd | -0.000725 | 0.00076154 | 5.0% |
| CZd | |||
| Cld | -0.005344 | 0.0054668 | 2.3% |
| Cmd | |||
| Cnd | -0.000032 | -0.00000049 | -101.5% |
Elevator
| AVL | flow5 | deviation | |
|---|---|---|---|
| CXd | |||
| CYd | |||
| CZd | 0.005236 | -0.0057114 | 9.1% |
| Cld | |||
| Cmd | -0.02009 | -0.021882 | 8.9% |
| Cnd |
Rudder
| AVL | flow5 | deviation | |
|---|---|---|---|
| CXd | |||
| CYd | 0.001242 | 0.0014878 | 19.8% |
| CZd | |||
| Cld | 0.000067 | 0.000075661 | 12.9% |
| Cmd | |||
| Cnd | -0.000489 | -0.00058663 | 20.0% |
The derivative which stands out is again Cnd, for the same reason as in the case of the stability derivatives. This is illustrated by a plot of Cnd vs. the angle of attack.
Not only is the absolute value of the derivative small, but it also exhibits in AVL an important variation with the angle of attack. This makes its estimation very sensitive to the setup of the model and of the analysis.

Sanity check: influence matrix
A numerical experiment was made in flow5 to evaluate the error implicit in the assumption that the linear system's matrix is not modified by the deflection of the control surfaces. The influence matrix was rebuilt for each of the aileron, elevator and rudder controls, and the problem was entirely solved for the derivatives in each case. The results were compared to those presented above in the VLM case.
Aileron
| Ref. | Mod. matrix | deviation | |
|---|---|---|---|
| CXd | |||
| CYd | 0.00076154 | 0.0007525 | 1.2% |
| CZd | |||
| Cld | 0.0054668 | 0.0054548 | 0.2% |
| Cmd | |||
| Cnd | -0.00000049 | -0.00000046 | 6.6% |
Elevator
| Ref. | Mod. matrix | deviation | |
|---|---|---|---|
| CXd | |||
| CYd | |||
| CZd | -0.0057114 | -0.0057132 | 0% |
| Cld | |||
| Cmd | -0.021882 | -0.021889 | 0% |
| Cnd |
Rudder
| Ref. | Mod. matrix | deviation | |
|---|---|---|---|
| CXd | |||
| CYd | 0.0014878 | 0.0014955 | -0.5% |
| CZd | |||
| Cld | 0.000075661 | 0.000076071 | -0.5% |
| Cmd | |||
| Cnd | -0.00058663 | -0.00058967 | -0.5% |
It appears that the differences are minor and no larger than the variations seen between the VLM2 and the tri-uniform method, which justifies the approximation.
Back to top
Conclusion and recommendations
Conclusions
The main conclusions of this sensitivity study are that- the derivatives exhibit various degrees of variability to the type of analysis
- the evaluation of the derivatives using panel methods are less precise than are the estimation of the lift, drag and moment coefficients.
Recommendations
- use preferably the estimations in a relative way to plot tendencies rather than in an absolute way
- use the same type of models and panel methods when comparing derivatives.
Back to top