
The Fujin experiment
Updated March 29, 2021
------------------ WORK IN PROGRESS ------------------
The Fujin experiment
The purpose of this page is to present a comparison of flow5 predictions to the experimental data published in
-
[1] Tahara, Y. Masuyama, T. Fukasawa and M. Katori (2012).
Sail Performance Analysis of Sailing Yachts by Numerical Calculations and Experiments, Fluid Dynamics, Computational Modeling and Applications, Dr. L. Hector Juarez (Ed.), ISBN: 978-953-51-0052-2, InTech -
[2] Yusuke Tahara and Toichi Fukasawa.
Database of sail shapes versus sail performance and validation of numerical calculations for the upwind condition, Journal of Marine Science and Technology, June 2009.
The authors have carried a comprehensive campaign of performance measurements abord their sailboat "Fujin" in real sailing conditions for different configurations of main sail and jib. The full sets of geometric data and experimental results are summarized in their publication.
The test cases that have been modelled and simulated in flow5 are
- Case 9807172B
- Case 98110105
- Case 96092335
- Case 96080248
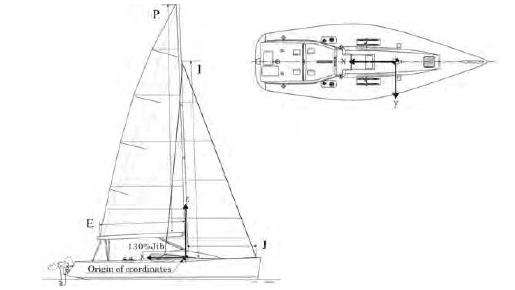
The Fujin - partial extract from Fig. 1 in ref. [1]
flow5 calculations
The calculations were performed with flow5 v7.08.
The corresponding project file can be downloaded here: Fujin.fl5.
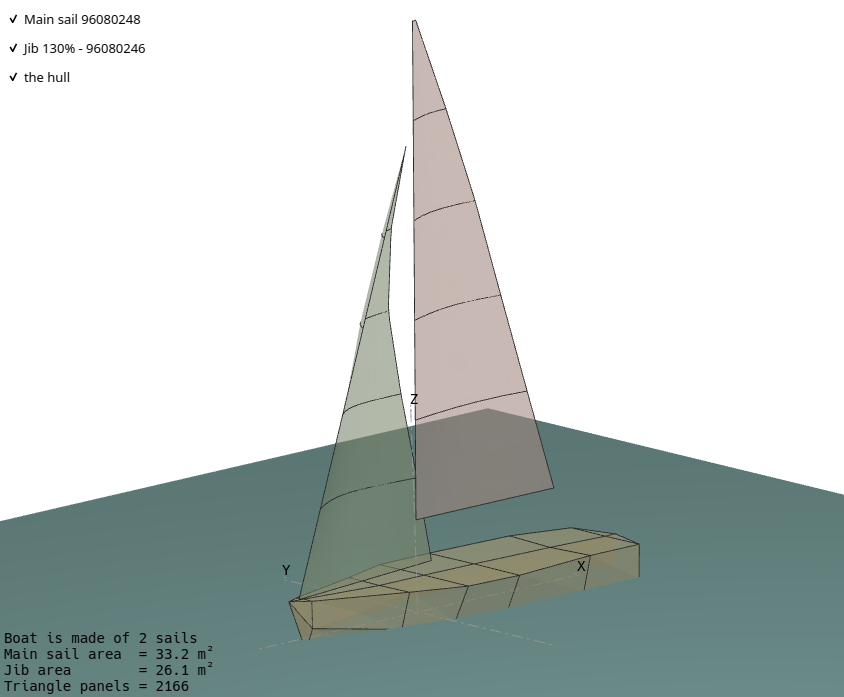
Model
Both sail have been modelled using the spline type sail, with each horizontal section defined as a cubic spline interpolating the geometric points measured during the experiment.
Although shown in the images, the hull was excluded from the analysis since the intersection of hull and water is not managed in flow5 v7.07.
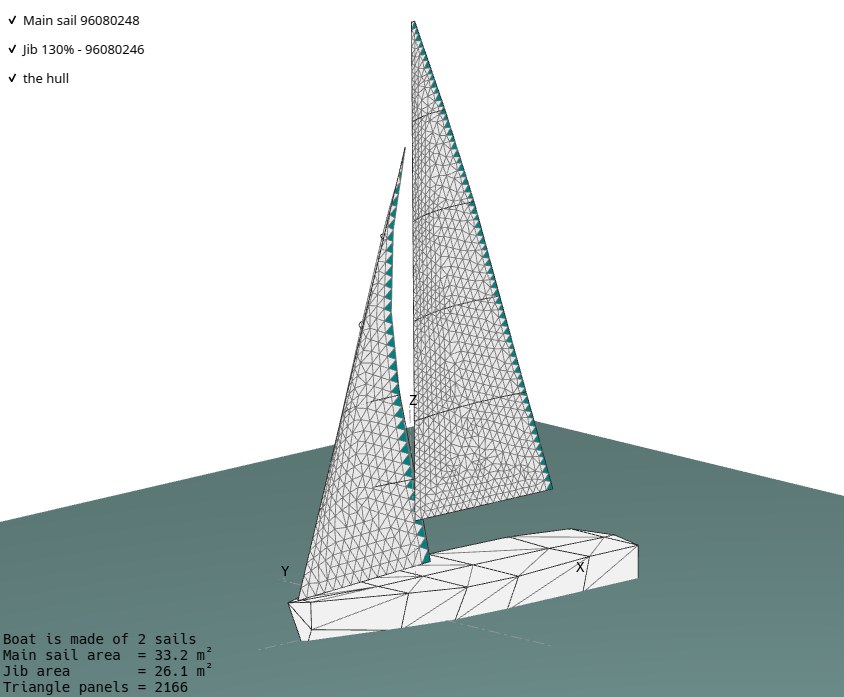
Mesh
The mesh of both sails is of the free type, preferred for the better quality of the triangular panels it provides at the gaff.
Sensivity analyses were performed with decreasing triangle sizes and increasing panel count. Also a test with a ruled mesh has been carried out in one case for comparison. All results are presented below.
Analysis
Panel method
The analysis is of the triangular uniform panel type. This method is the recommended type in flow5 for its robustness, speed and versatility.
The reasons for this preference are that the linear method is not significantly more accurate, and that the errors due to the approximative wake model are significantly higher than the precision of the panel method.
A comparative analysis of the two panel orders has nonetheless been carried out and the results are presented below.
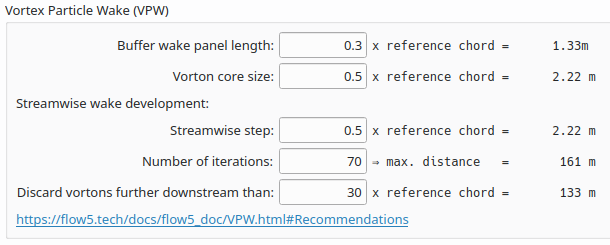
Wake model
The wake model is the Vortex Particle Wake (VPW) which is the recommended type in flow5 whenever accuracy is preferred over analysis times.
The settings of the VPW have been adjusted to minimize the vorton core size while maintaining a stable wake shape, in accordance with these recommendations.
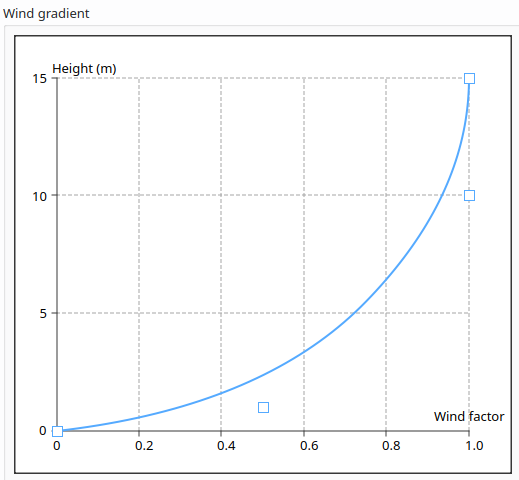
Wind gradient
The wind gradient parabola has been adjusted to represent approximately the gradient presented in Figure 7 of ref. [2].
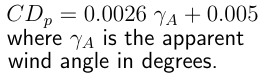
Extra drag
Since the sail calculations in flow5 are of the inviscid type, the additional component given in equation 2 of ref. [2] has been added to the results.
Results
Foreword
The results presented below are those obtained with flow5 7.08 and using the meshes and the analysis setttings defined in the project file. The intent is to build experience with the sail module and try to improve these predictions.
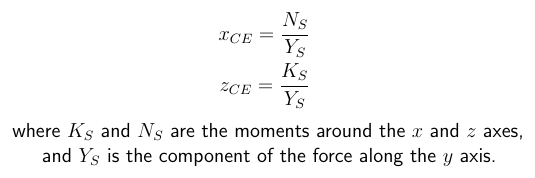
Moments
Test case 96092335
| AWA (°) | Twist (°) | Draft (%) | AWS (m/s) | Heel (°) | VB (kt) |
|---|---|---|---|---|---|
| 30.7 | 15.5 | 8.6 | 6.9 | 15.1 | 5.0 |
This is a standard case with average AWA. No simple explanation could be found for the difference between the measured and predicted lift coefficients.
This test case was used to evaluate the influence of the analysis settings. It shows that the results are not too sensitive to
- the number of panels and the type of mesh: free or ruled
- the type of surface densities, i.e. uniform or linear
- the wake model
| CL | CD | CX | CY | XCE (m) | ZCE (m) | |
|---|---|---|---|---|---|---|
| Measured | 1.44 | 0.28 | 0.50 | 1.39 | 0.41 | 4.17 |
| free mesh 1359 uniform triangles VPW |
1.15 | 0.14 | -0.54 | 1.02 | 0.89 | 4.63 |
| free mesh 2078 uniform triangles VPW |
1.18 | 0.14 | -0.55 | 1.05 | 0.80 | 4.36 |
| free mesh 2078 linear triangles VPW |
1.20 | 0.15 | -0.57 | 1.07 | 0.71 | 4.29 |
| free mesh 2078 linear triangles Flat wake |
1.18 | 0.17 | -0.53 | 1.05 | 0.38 | 4.04 |
| ruled mesh 1188 uniform triangles VPW |
1.16 | 0.14 | -0.54 | 1.02 | 0.90 | 4.72 |
Test case 9807172B
| AWA (°) | Twist (°) | Draft (%) | AWS (m/s) | Heel (°) | VB (kt) |
|---|---|---|---|---|---|
| 29.8 | 10.9 | 9.3 | 7.2 | 8.3 | 4.2 |
This configuration was with the main sail only and no jib. The authors caution in [2] that the measurement of the AWA was made uncertain due to difficulties to steer the boat, and that flow separation on the sail was greater than in the case with the jib. The results should therefore be considered with caution.
| CL | CD | CX | CY | XCE (m) | ZCE (m) | |
|---|---|---|---|---|---|---|
| Measured | 1.25 | 0.45 | 0.19 | 1.31 | 1.68 | 5.86 |
| free mesh 1485 uniform triangles VPW |
1.17 | 0.14 | 0.57 | 1.04 | 1.90 | 5.97 |
Test case 98110105
| AWA (°) | Twist (°) | Draft (%) | AWS (m/s) | Heel (°) | VB (kt) |
|---|---|---|---|---|---|
| 20.5 | 14.5 | 7.9 | 8.6 | 11.6 | 4.8 |
This is the measurement performed with the lowest AWA, i.e. in theory the condition closest to those of the panel method's ideal potential flow.
| CL | CD | CX | CY | XCE (m) | ZCE (m) | |
|---|---|---|---|---|---|---|
| Measured | 1.15 | 0.20 | 0.22 | 1.15 | 0.65 | 4.73 |
| free mesh 1376 uniform triangles VPW |
1.19 | 0.12 | -0.36 | 1.14 | 0.86 | 5.59 |
Test case 96080248
| AWA (°) | Twist (°) | Draft (%) | AWS (m/s) | Heel (°) | VB (kt) |
|---|---|---|---|---|---|
| 37.9 | 14.5 | 7.2 | 7.5 | 19.6 | 6.0 |
This test case is for a large angle of attack, for which the authors state that both the main sail and the jib were not eased sufficiently. This may have caused flow conditions far off from the ideal laminar flow and hence the results are not significant.
| CL | CD | CX | CY | XCE (m) | ZCE (m) | |
|---|---|---|---|---|---|---|
| Measured | 1.58 | 0.45 | 0.62 | 1.52 | 0.34 | 4.17 |
| free mesh 2088 uniform triangles VPW |
1.51 | 0.19 | -0.86 | 1.24 | 1.02 | 4.61 |
Analysis of the results
The first and main observation is that the predictions are not as close to the measurements as they are in the case of the Jibe 2 experiment. There are several potential explanations for this difference.
On the measurement side:
- The test conditions at sea are by nature unstable: the wind speed, angle, and wind gradient vary constantly, and so does the boat's position w.r.t the water. This adds a measure of randomness to the results which the authors have done their best to minimize but which could not be totally avoided.
- The water itself is not the flat frictionless surface assumed in the calculations.
- The measurement of forces acting on the boat is more complex and less acurate than it would be in a wind tunnel.
More importantly, the cause of the discrepancies is likely to be found on the analysis side:
- The assumption of inviscid flow without separation implicit in the panel methods is insufficient to account for the conditions of large TWA at which the sails operate, with high probability of flow separation on the suction side of the sail. This adds significant error to the estimation of the lift and drag coefficients.
- Other potential reasons of lesser importance:
- The wind gradient adds a level of difficulty and uncertainty to the calculation of the induced drag in the far-field plane.
- The exact height of the axes origin in Fig. 1 could not be found in the publications. An approximate height above water = 1.2 m was measured approximately in Fig. 1 and 11 and was used in the calculations. This may add to the imprecision of predictions since the height to ground has a strong influence on the predicted results.
- The reference point for the calculation of moments could not be found in the publlications, so it was assumed that it is the origin of the axes. This assumption seems natural and is consistent with the results.
As mentioned above the test case 98110105, is the one most likely to give results closest to the predictions, with indeed the measured and predicted lift coefficients close within a few percent. This however may not be significant since flow separation is likely to be present at this AWA, which is confirmed by the under-prediction of the drag coefficient.